Most modern businesses don't have a data collection problem—they have an insight problem. Vital growth opportunities remain trapped inside fragmented spreadsheets and disconnected systems. We design bespoke executive dashboards that transform complex, scattered metrics into a centralized source of operational truth, empowering leadership to make proactive decisions with absolute confidence.
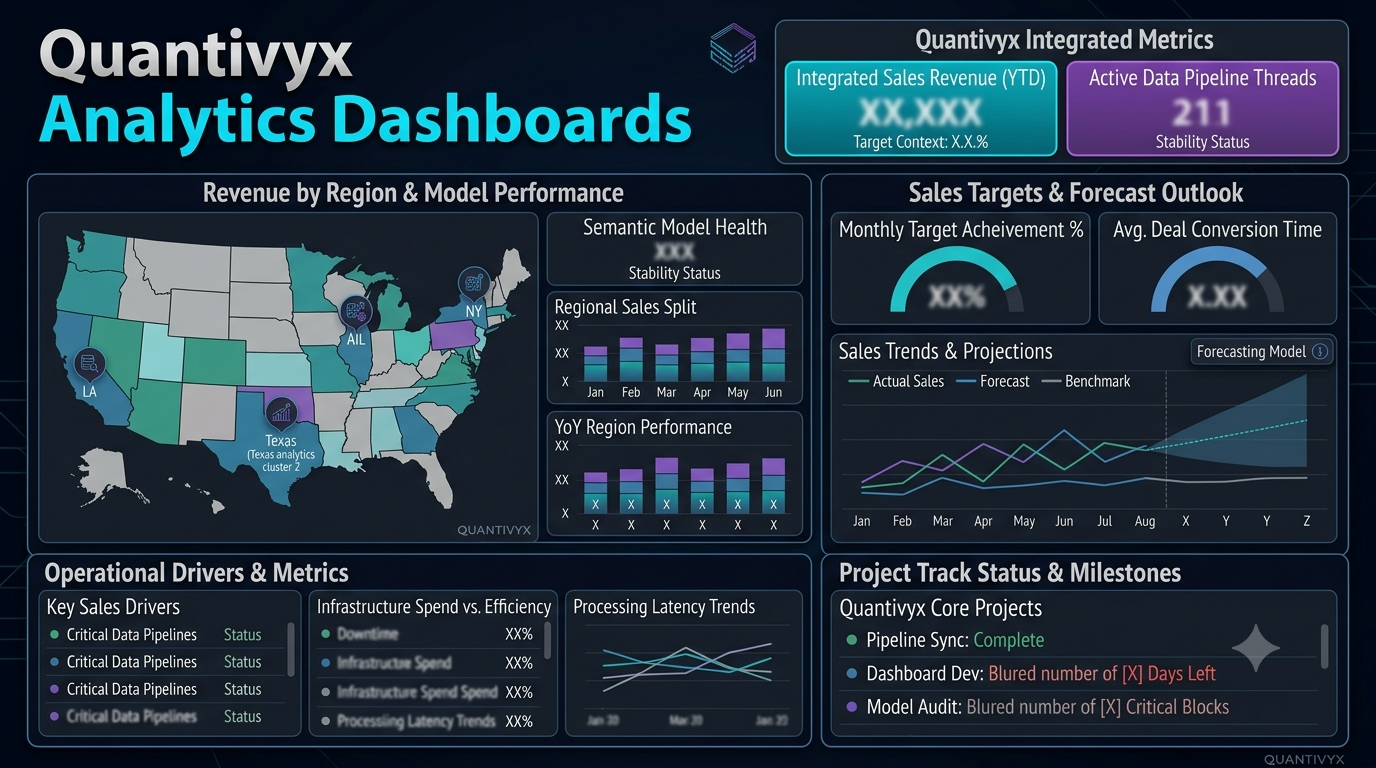
Enterprise Sales Command Center
A comprehensive national revenue matrix designed for C-suite decision-makers. This dashboard consolidates multi-regional performance data, year-over-year growth trajectories, and forward-looking projections into a single pane of glass, ensuring leadership instantly identifies high-performing sectors and market trends.
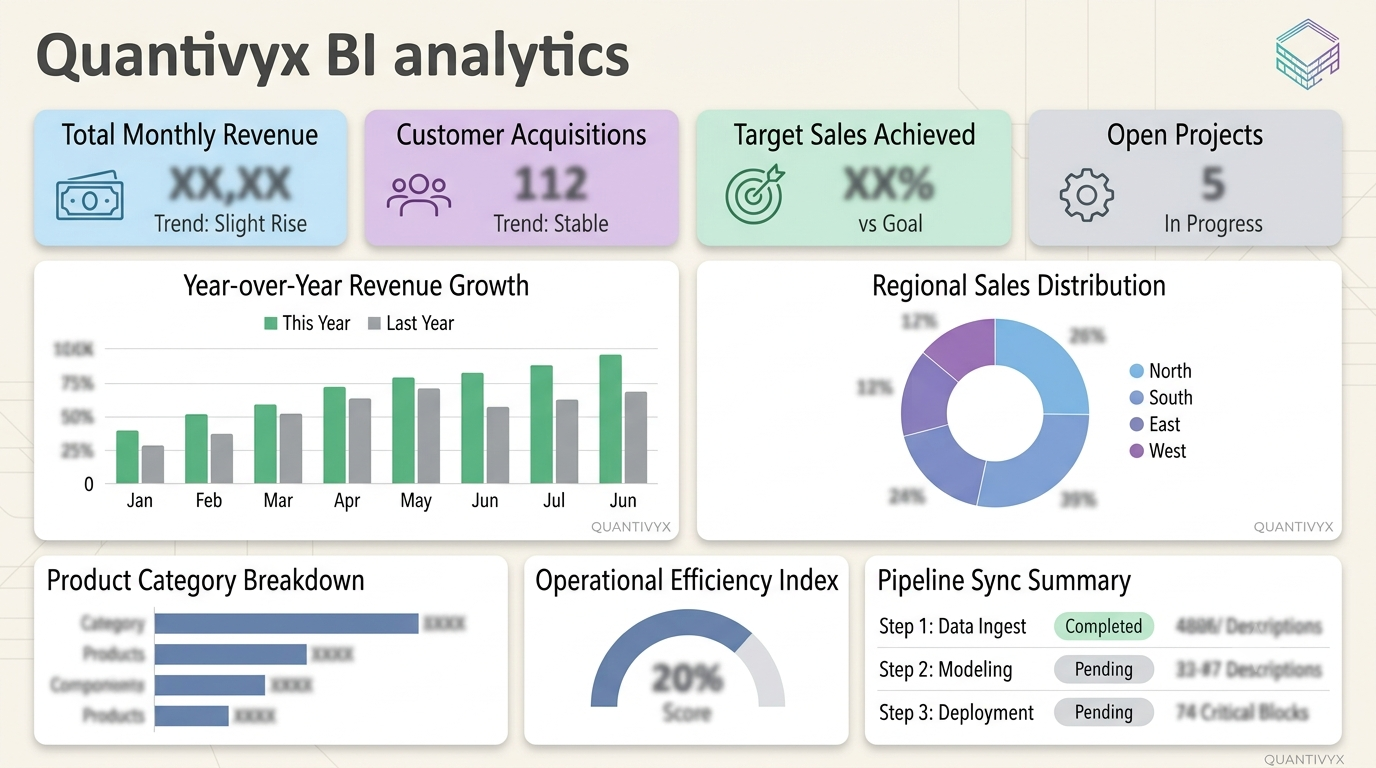
Corporate Growth & Performance Matrix
An intuitive executive health tracker that evaluates monthly customer acquisitions, target achievements, and active operational scores. Built specifically to eliminate data overload, this presentation leverages contrasting, clean typography to highlight foundational performance benchmarks at a glance.
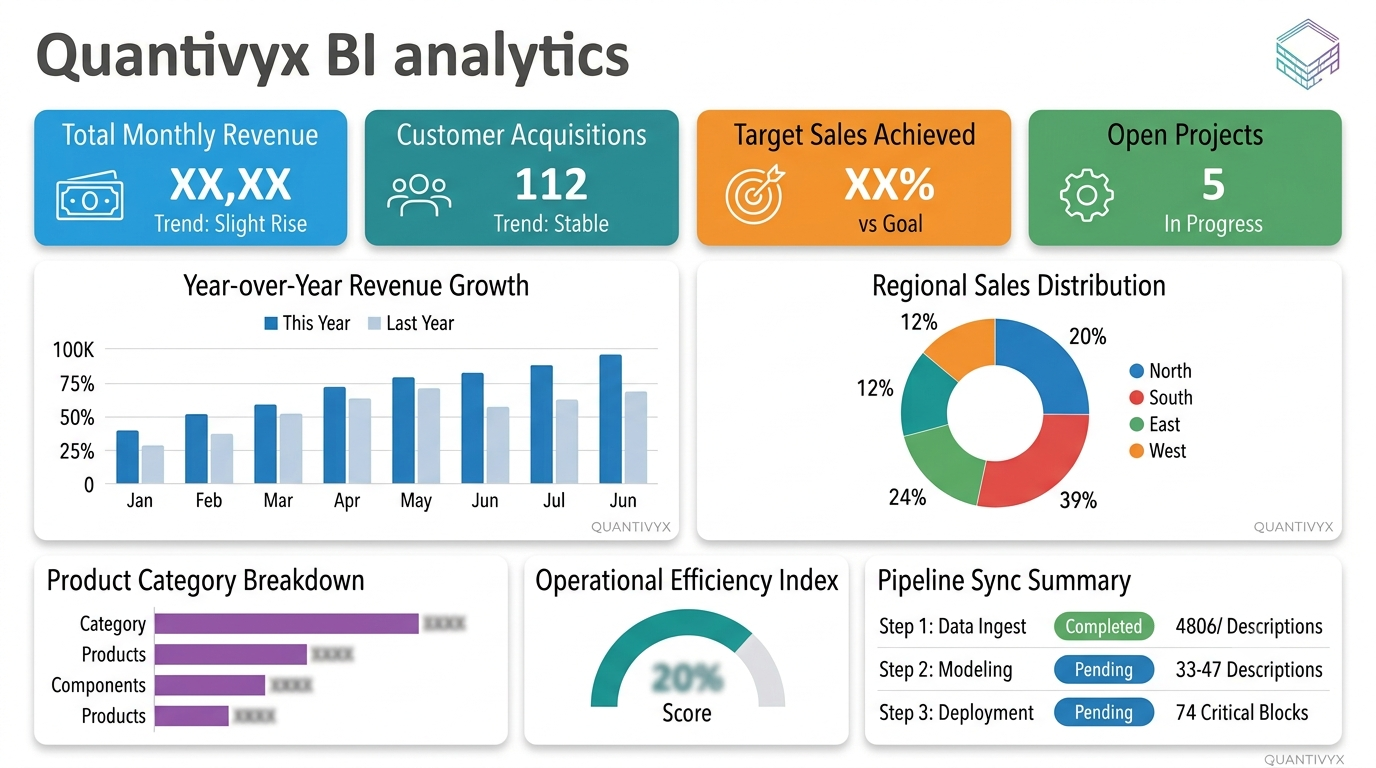
Operational Health & Project Monitor
A streamlined, accessible overview tailored for operations executives. This variation showcases critical pipeline tracking, regional revenue splits, and organizational health metrics using balanced layout structures that prioritize quick mental parsing and zero technical friction.
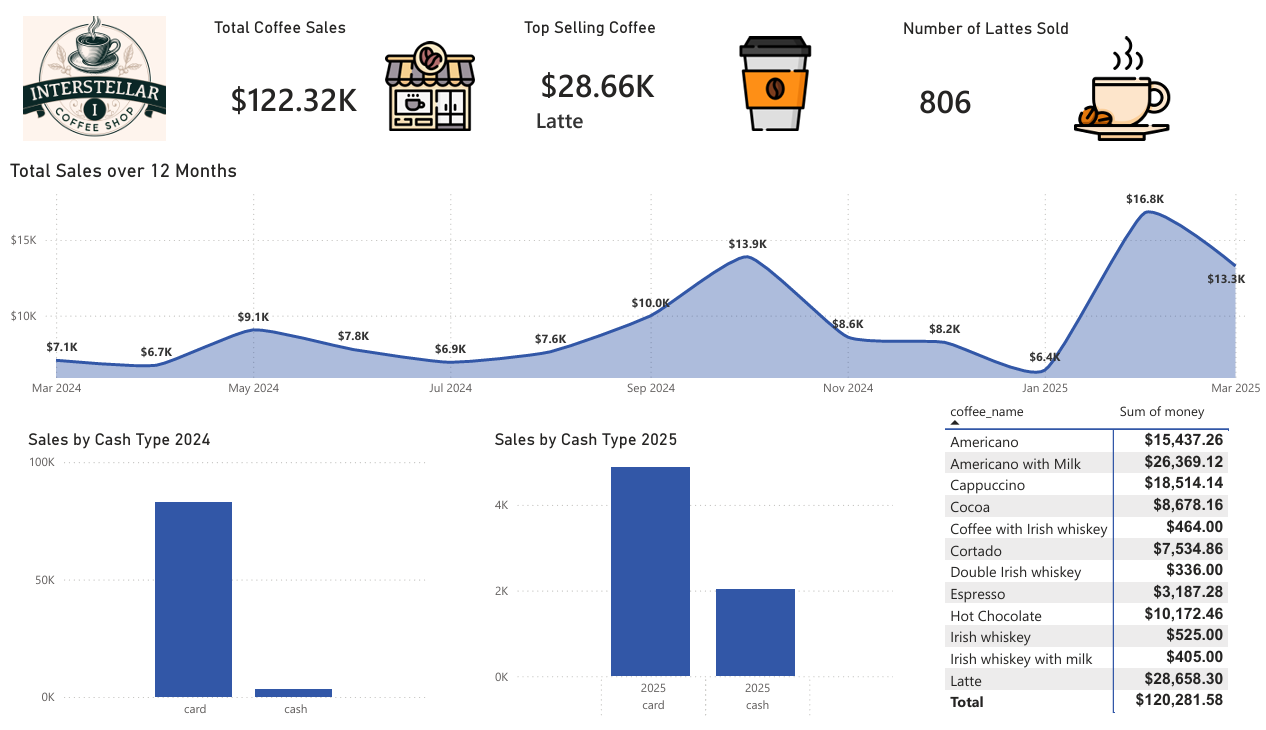
Retail Revenue & Commercial Intelligence
A granular point-of-sale overview tracking localized retail activity. This interface showcases how transactional volume, payment preferences, and itemized menu performance can be mapped over a 12-month period to reveal distinct seasonal demand spikes and consumer purchasing habits.
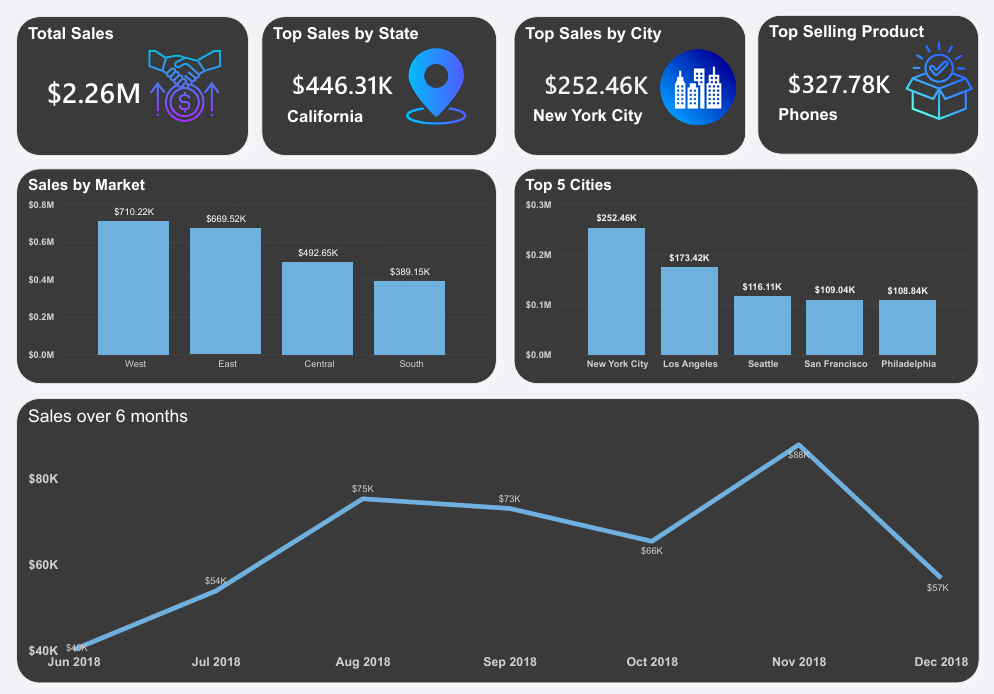
Executive High-Value Market Dashboard
A dark-mode financial intelligence panel optimized for corporate review. It strips away technical complexity to put multi-million dollar performance metrics front and center, instantly visualizing high-performing states, top-selling product categories, and key regional profit trends over a rolling six-month cycle.